Worked Examples
What do the uncertainties mean? Measurement errors describe the assumed observation distribution. Reported parameter errors come from a quadratic approximation of the cost function around the best fit; profile-likelihood scans show where that approximation breaks down. A confidence band for the fitted model shows the uncertainty of the curve, not the scatter of future measurements; request band=:prediction when that scatter is wanted. ScientificFitting uses optimization, not posterior sampling. The Statistics Reference explains these distinctions and the assumptions behind interval coverage (how often such intervals contain the true value).
Start with the Quickstart, a linear calibration, for the shortest complete analysis, or choose the example closest to your data below. Every page contains the measurements, assumptions, executable code, actual program output, diagnostics, and scientific interpretation.
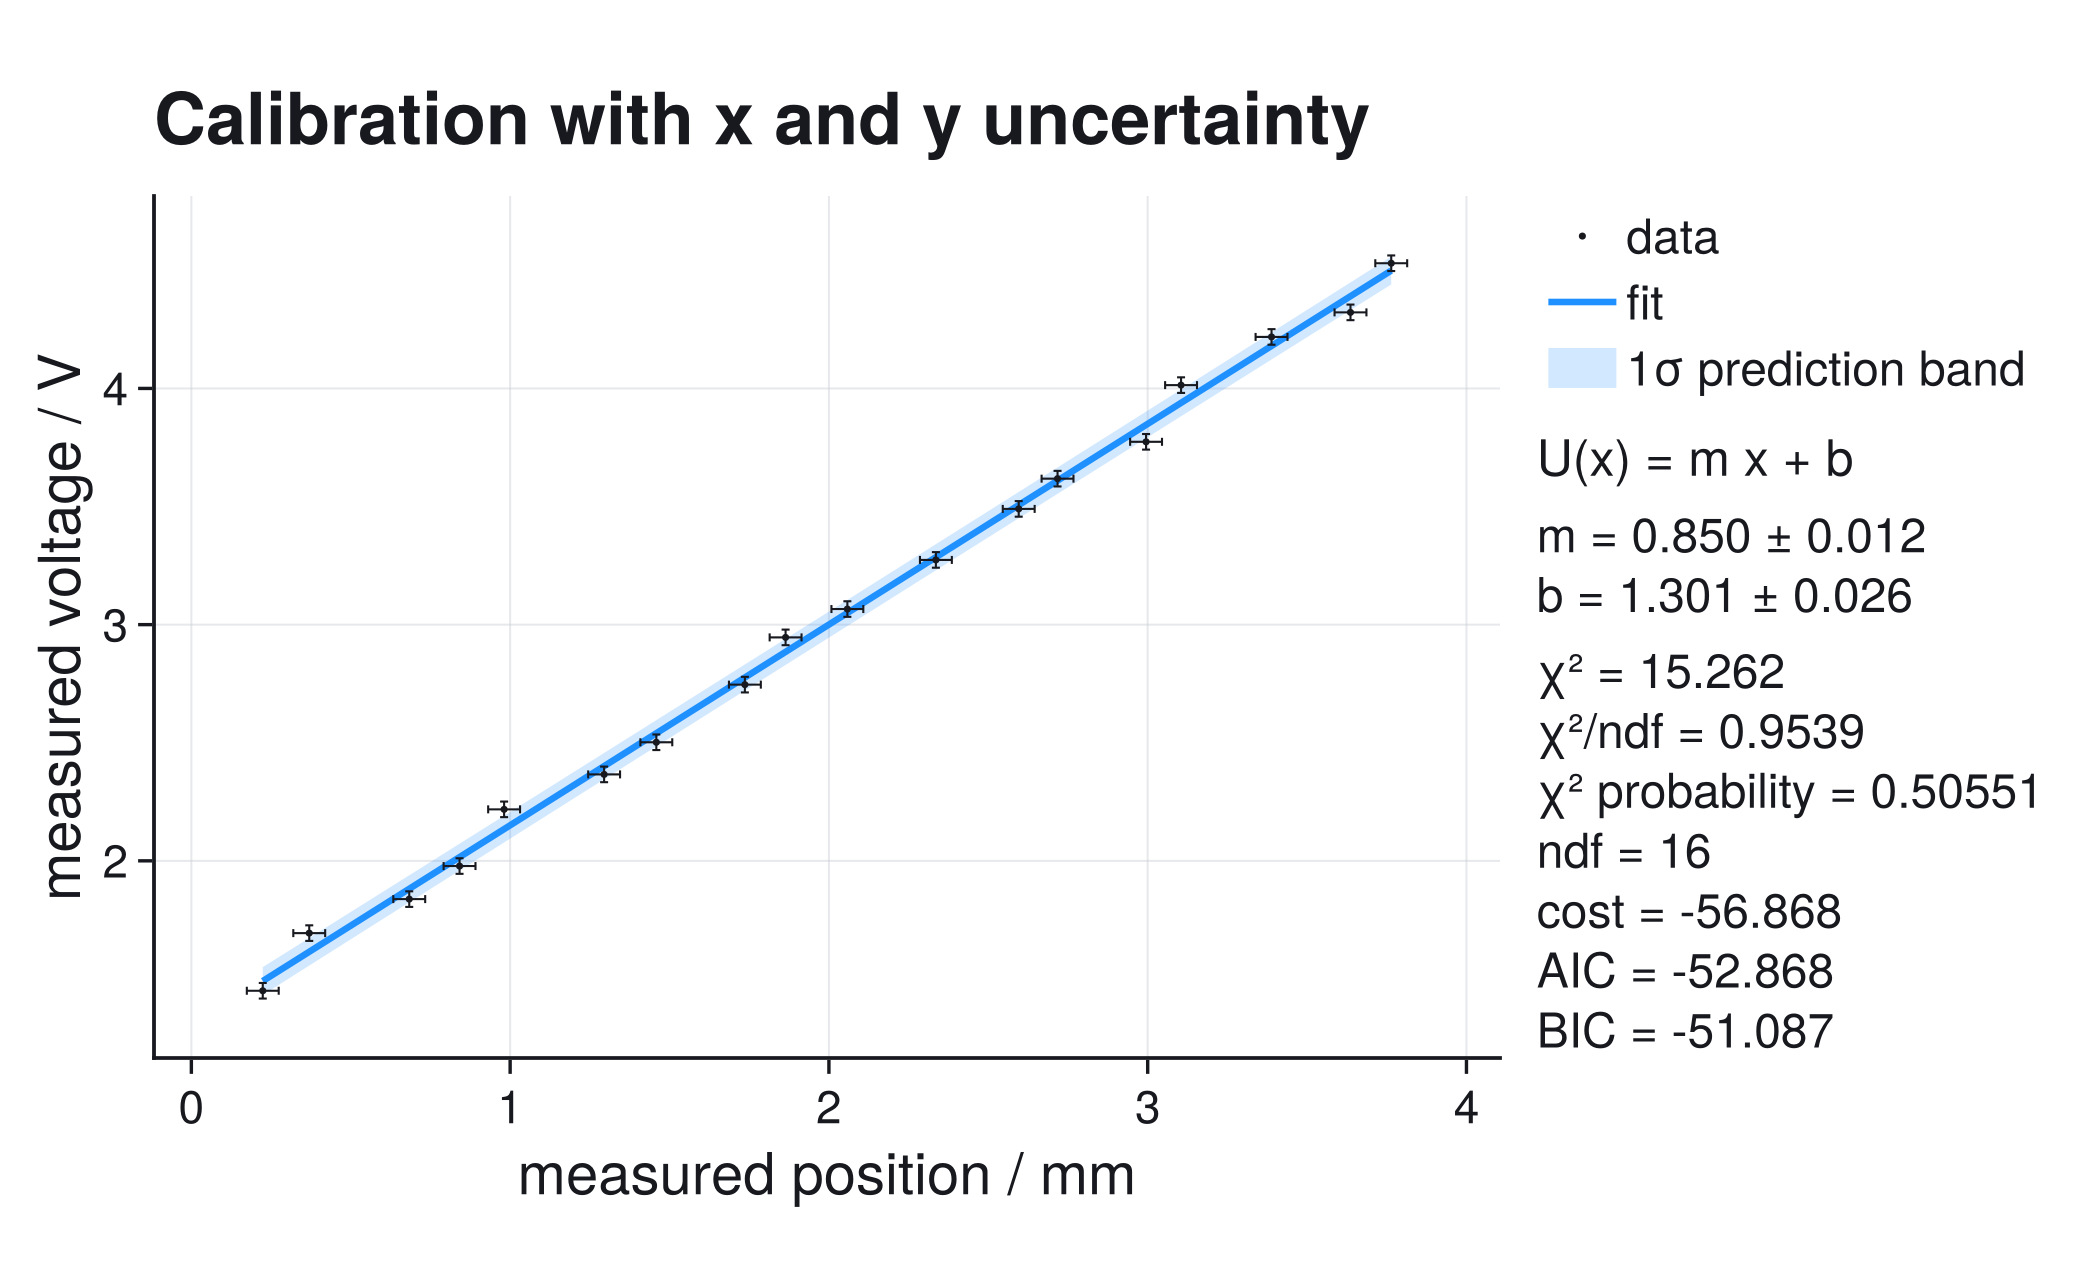
XY uncertainties
Include uncertainty in the independent variable through the local model slope, when calibration, frequency, voltage, or position errors are not negligible.
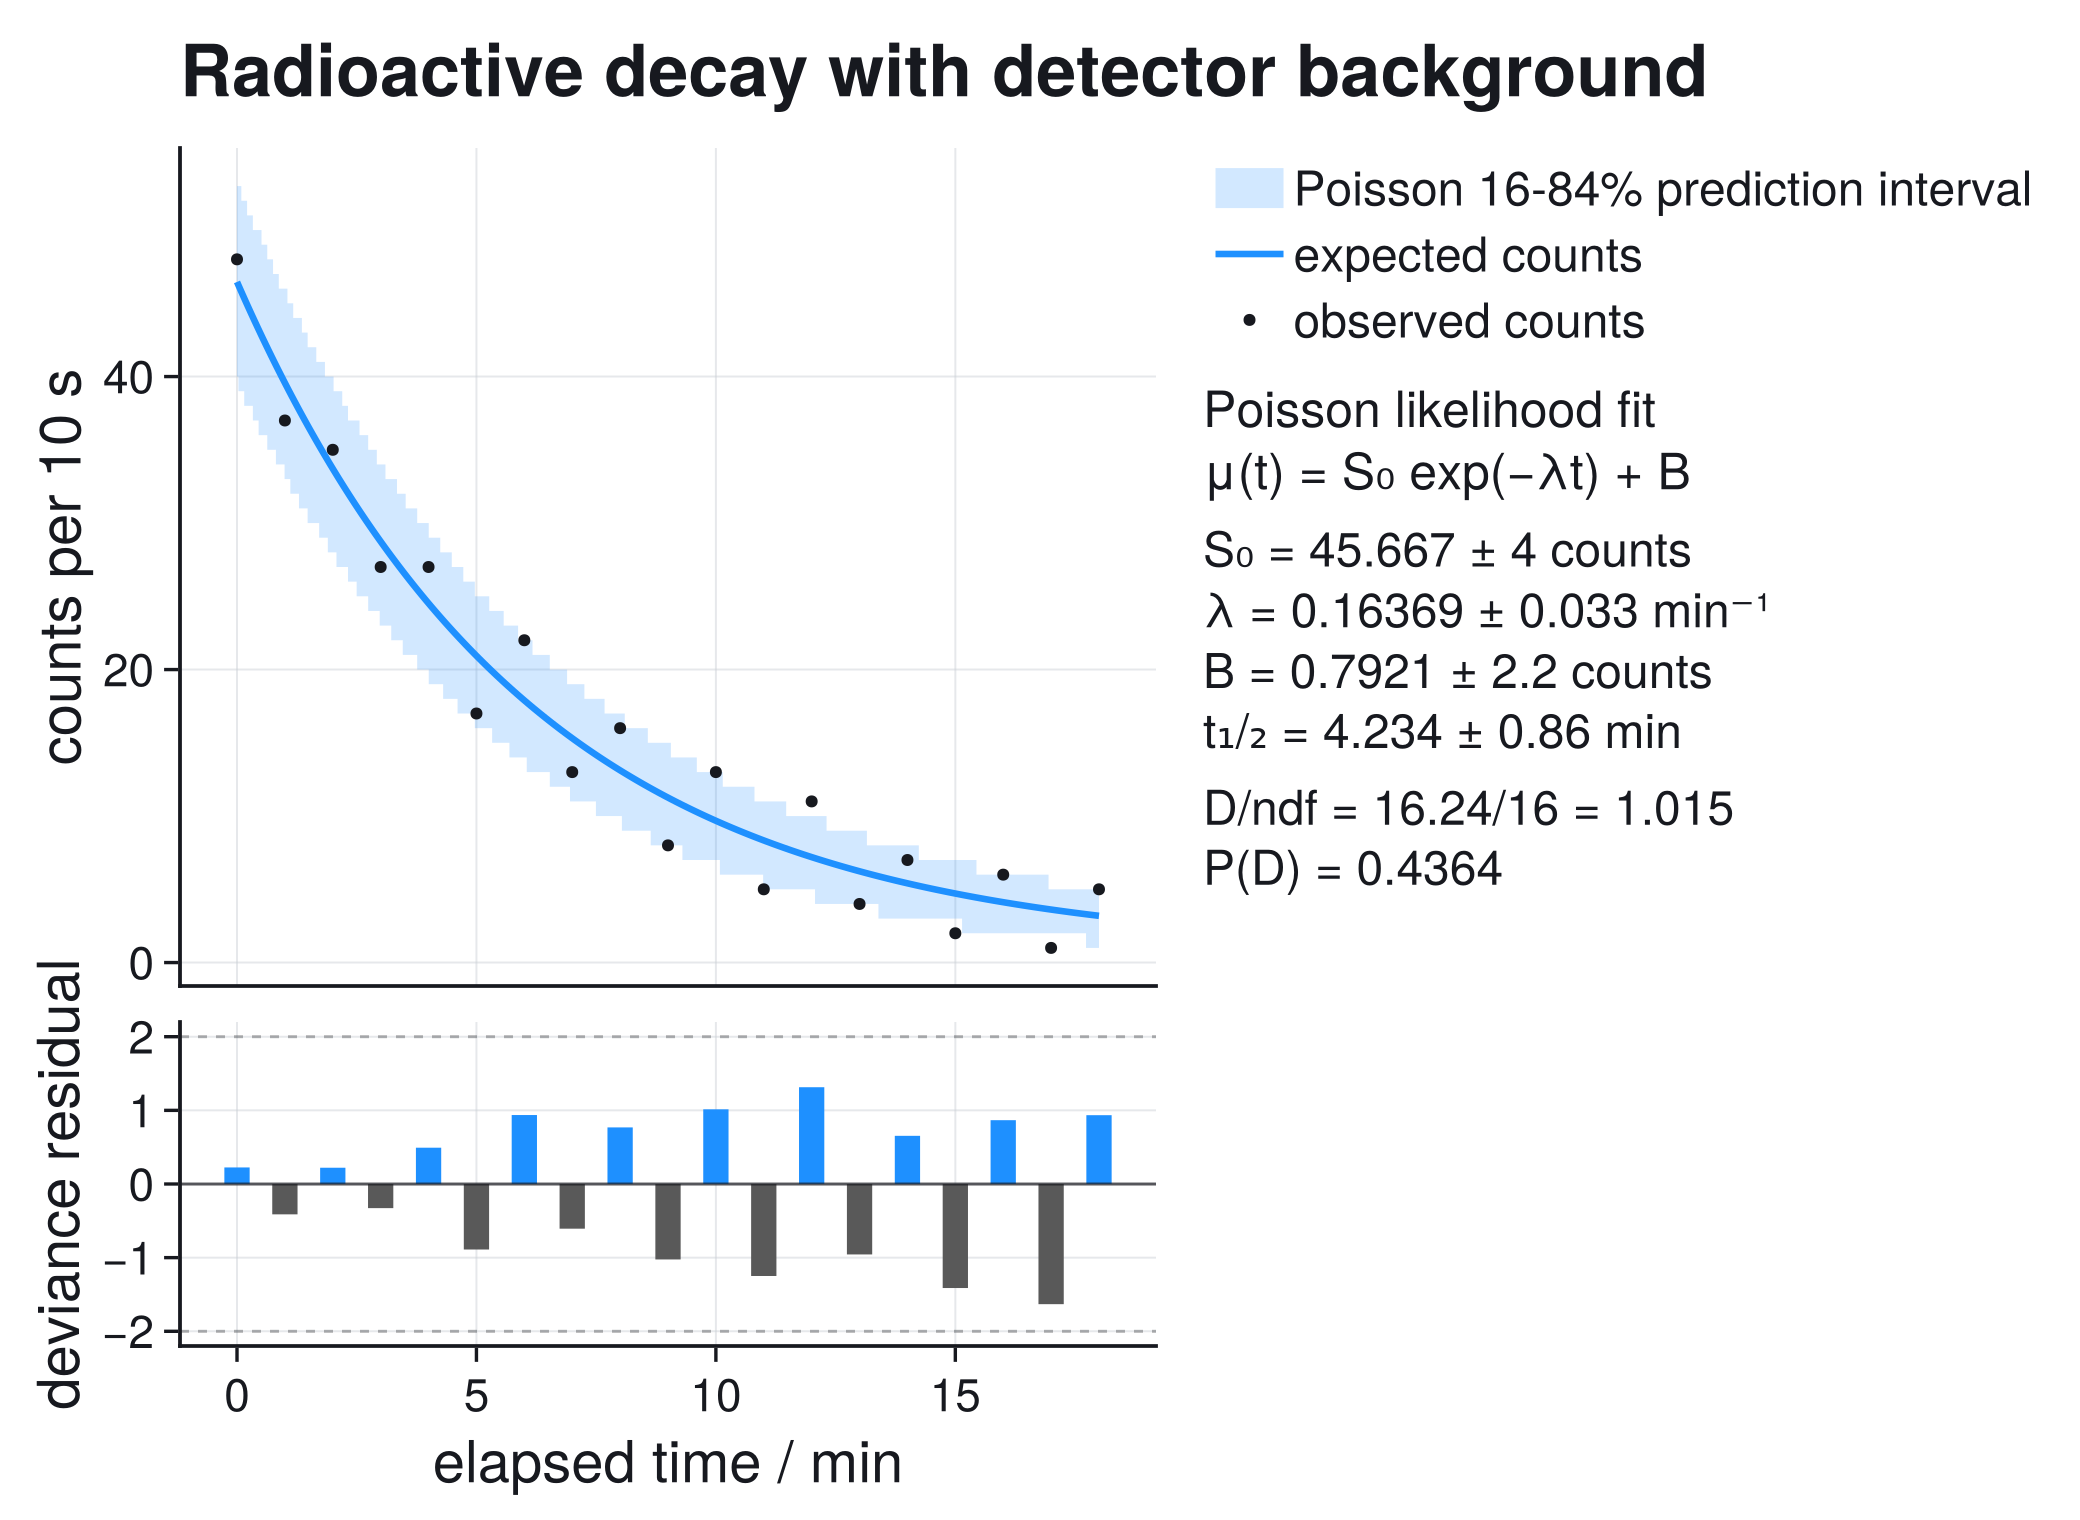
Poisson and histograms
Extract a radioactive half-life and a detector peak from sparse counts. Exact count semantics, integrated unequal bins, empty bins, and deviance residuals replace invented Gaussian error bars.
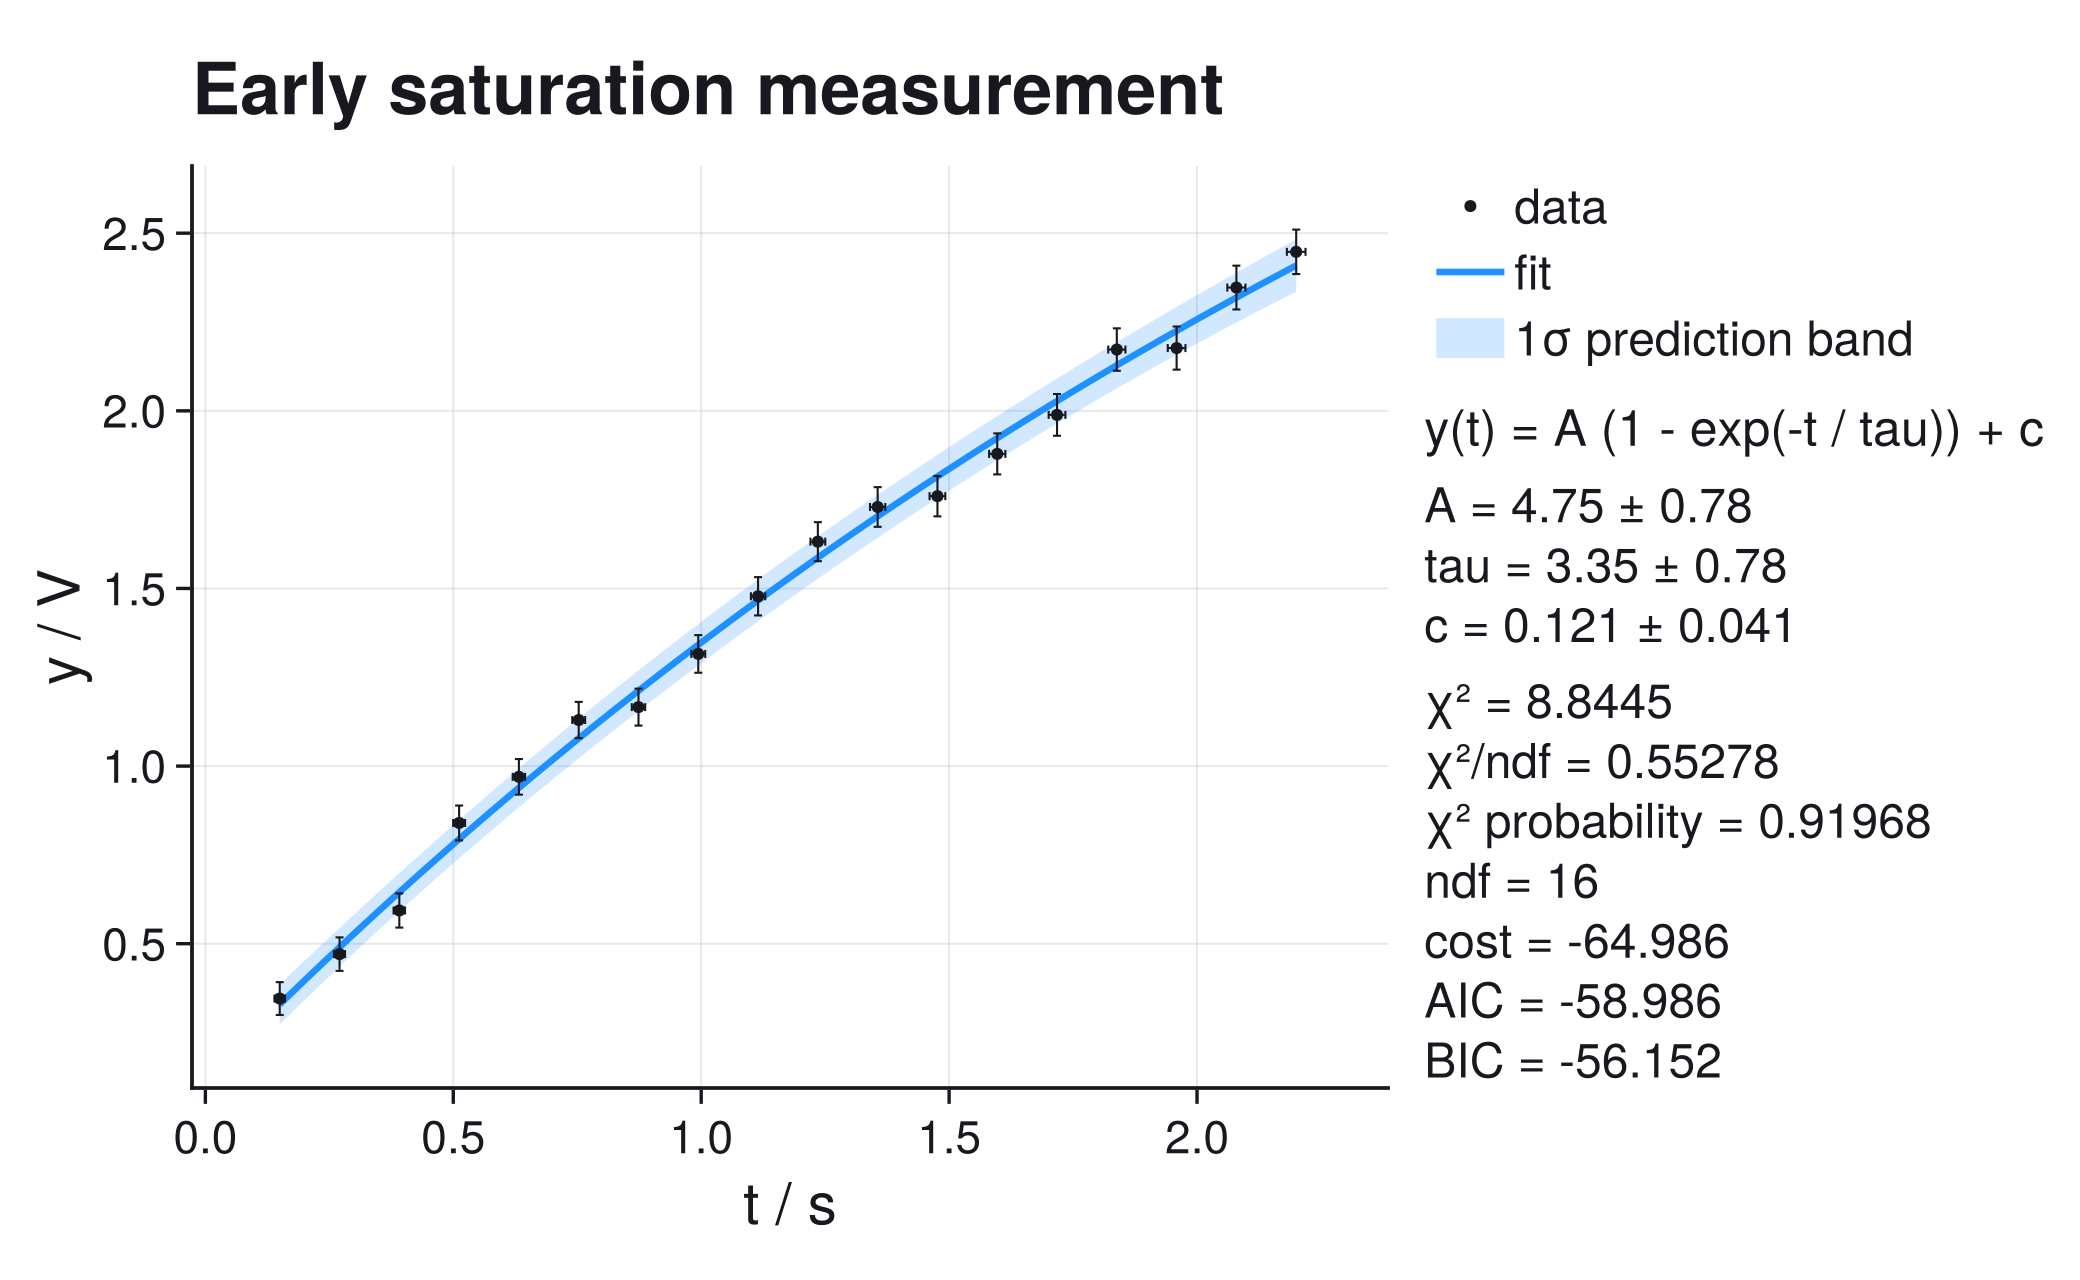
Constraints and profiles
A saturation measurement stopped before the plateau leaves amplitude and time constant nonlinearly coupled. Profiles and two-parameter regions show why the local covariance summary fails.
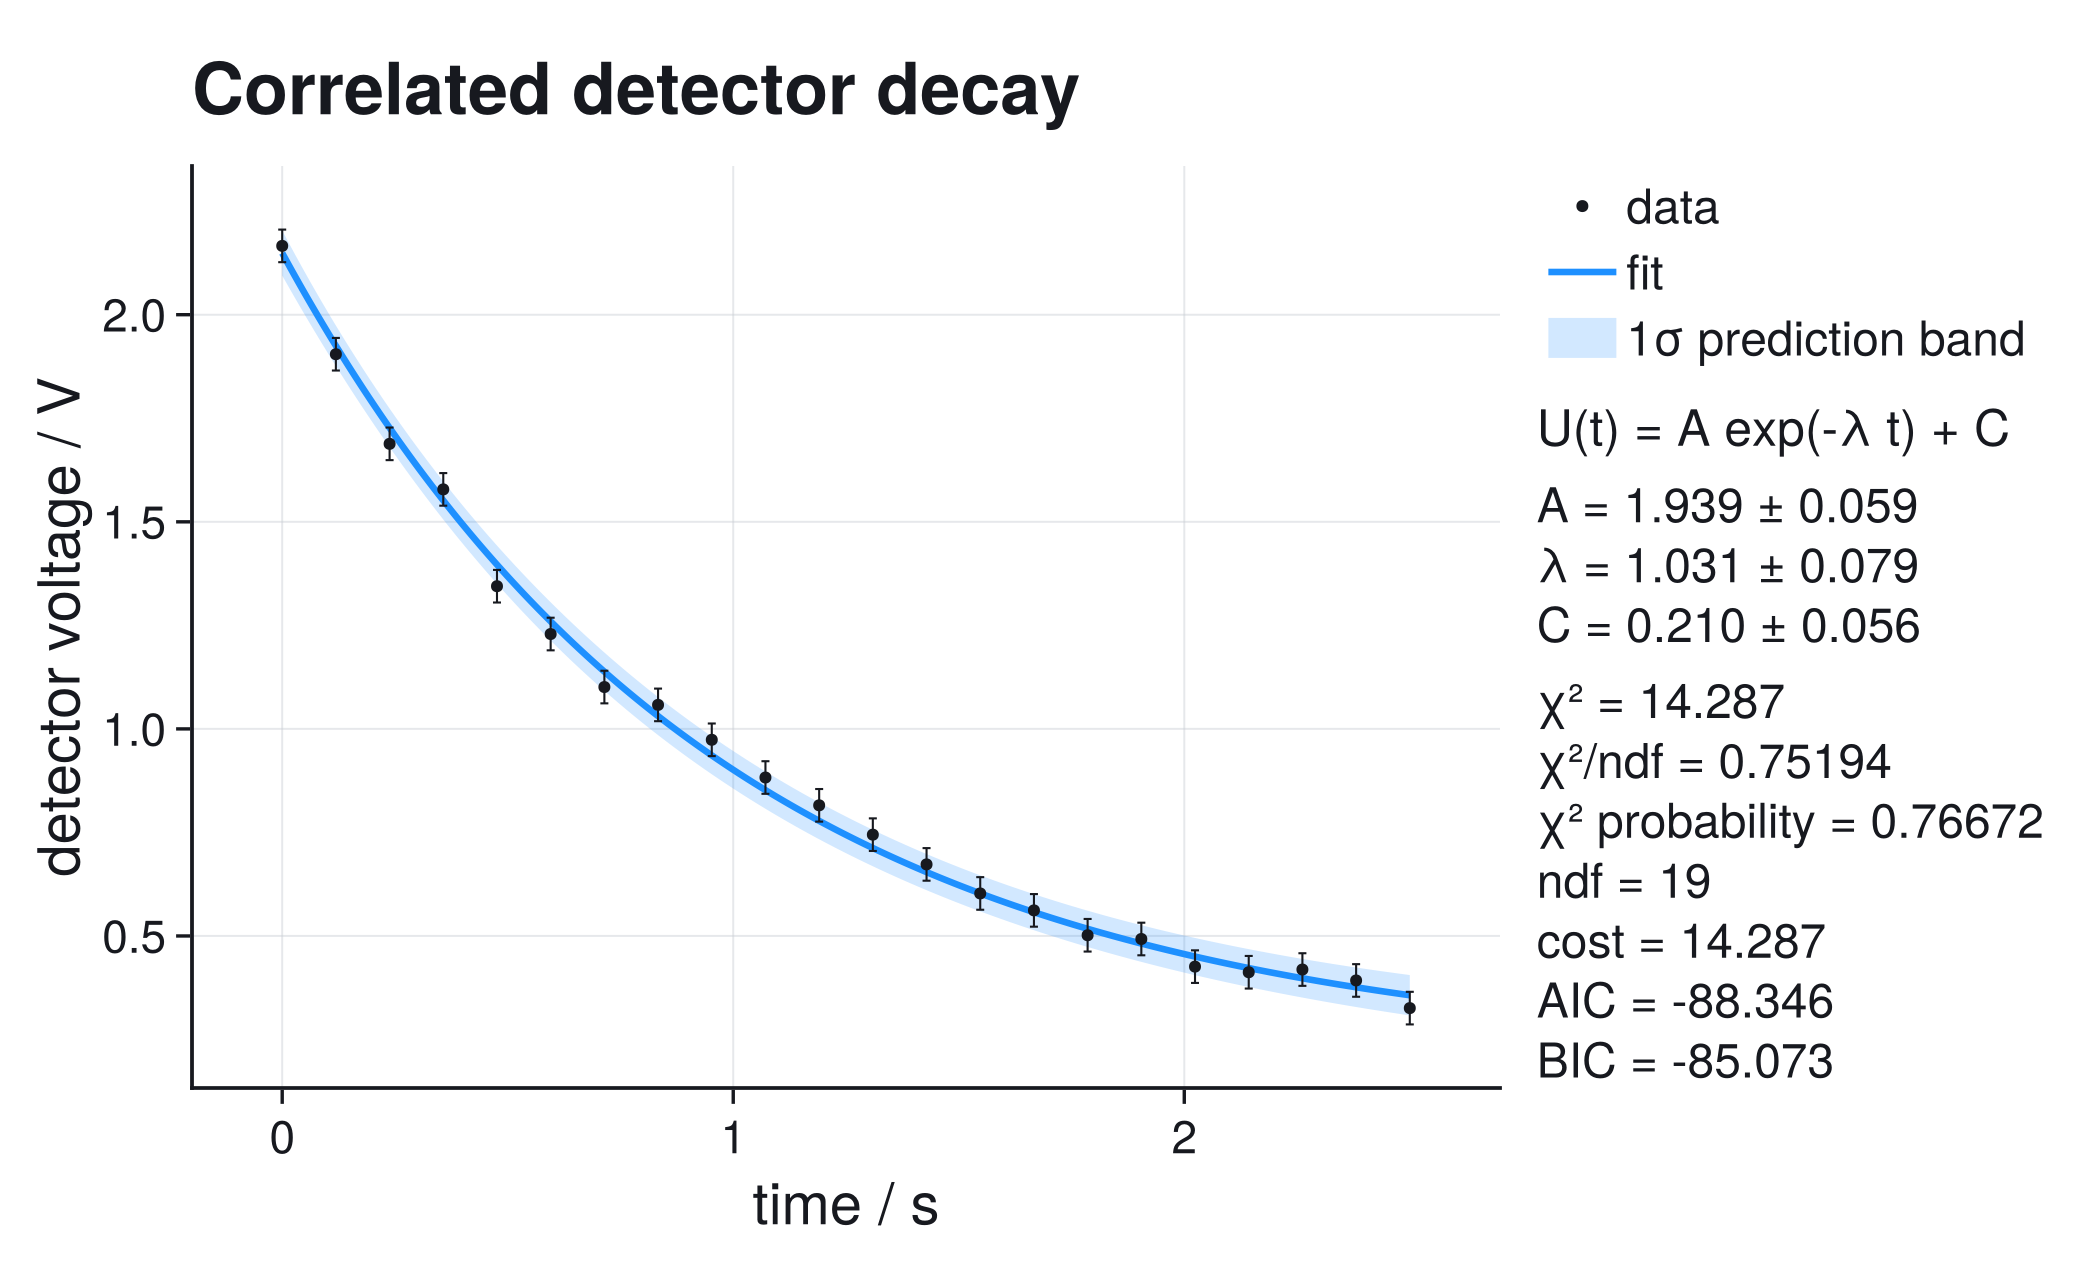
Full covariance
Use a dense covariance matrix when measurements share readout noise, and see how correlations change parameter uncertainty and goodness-of-fit interpretation.
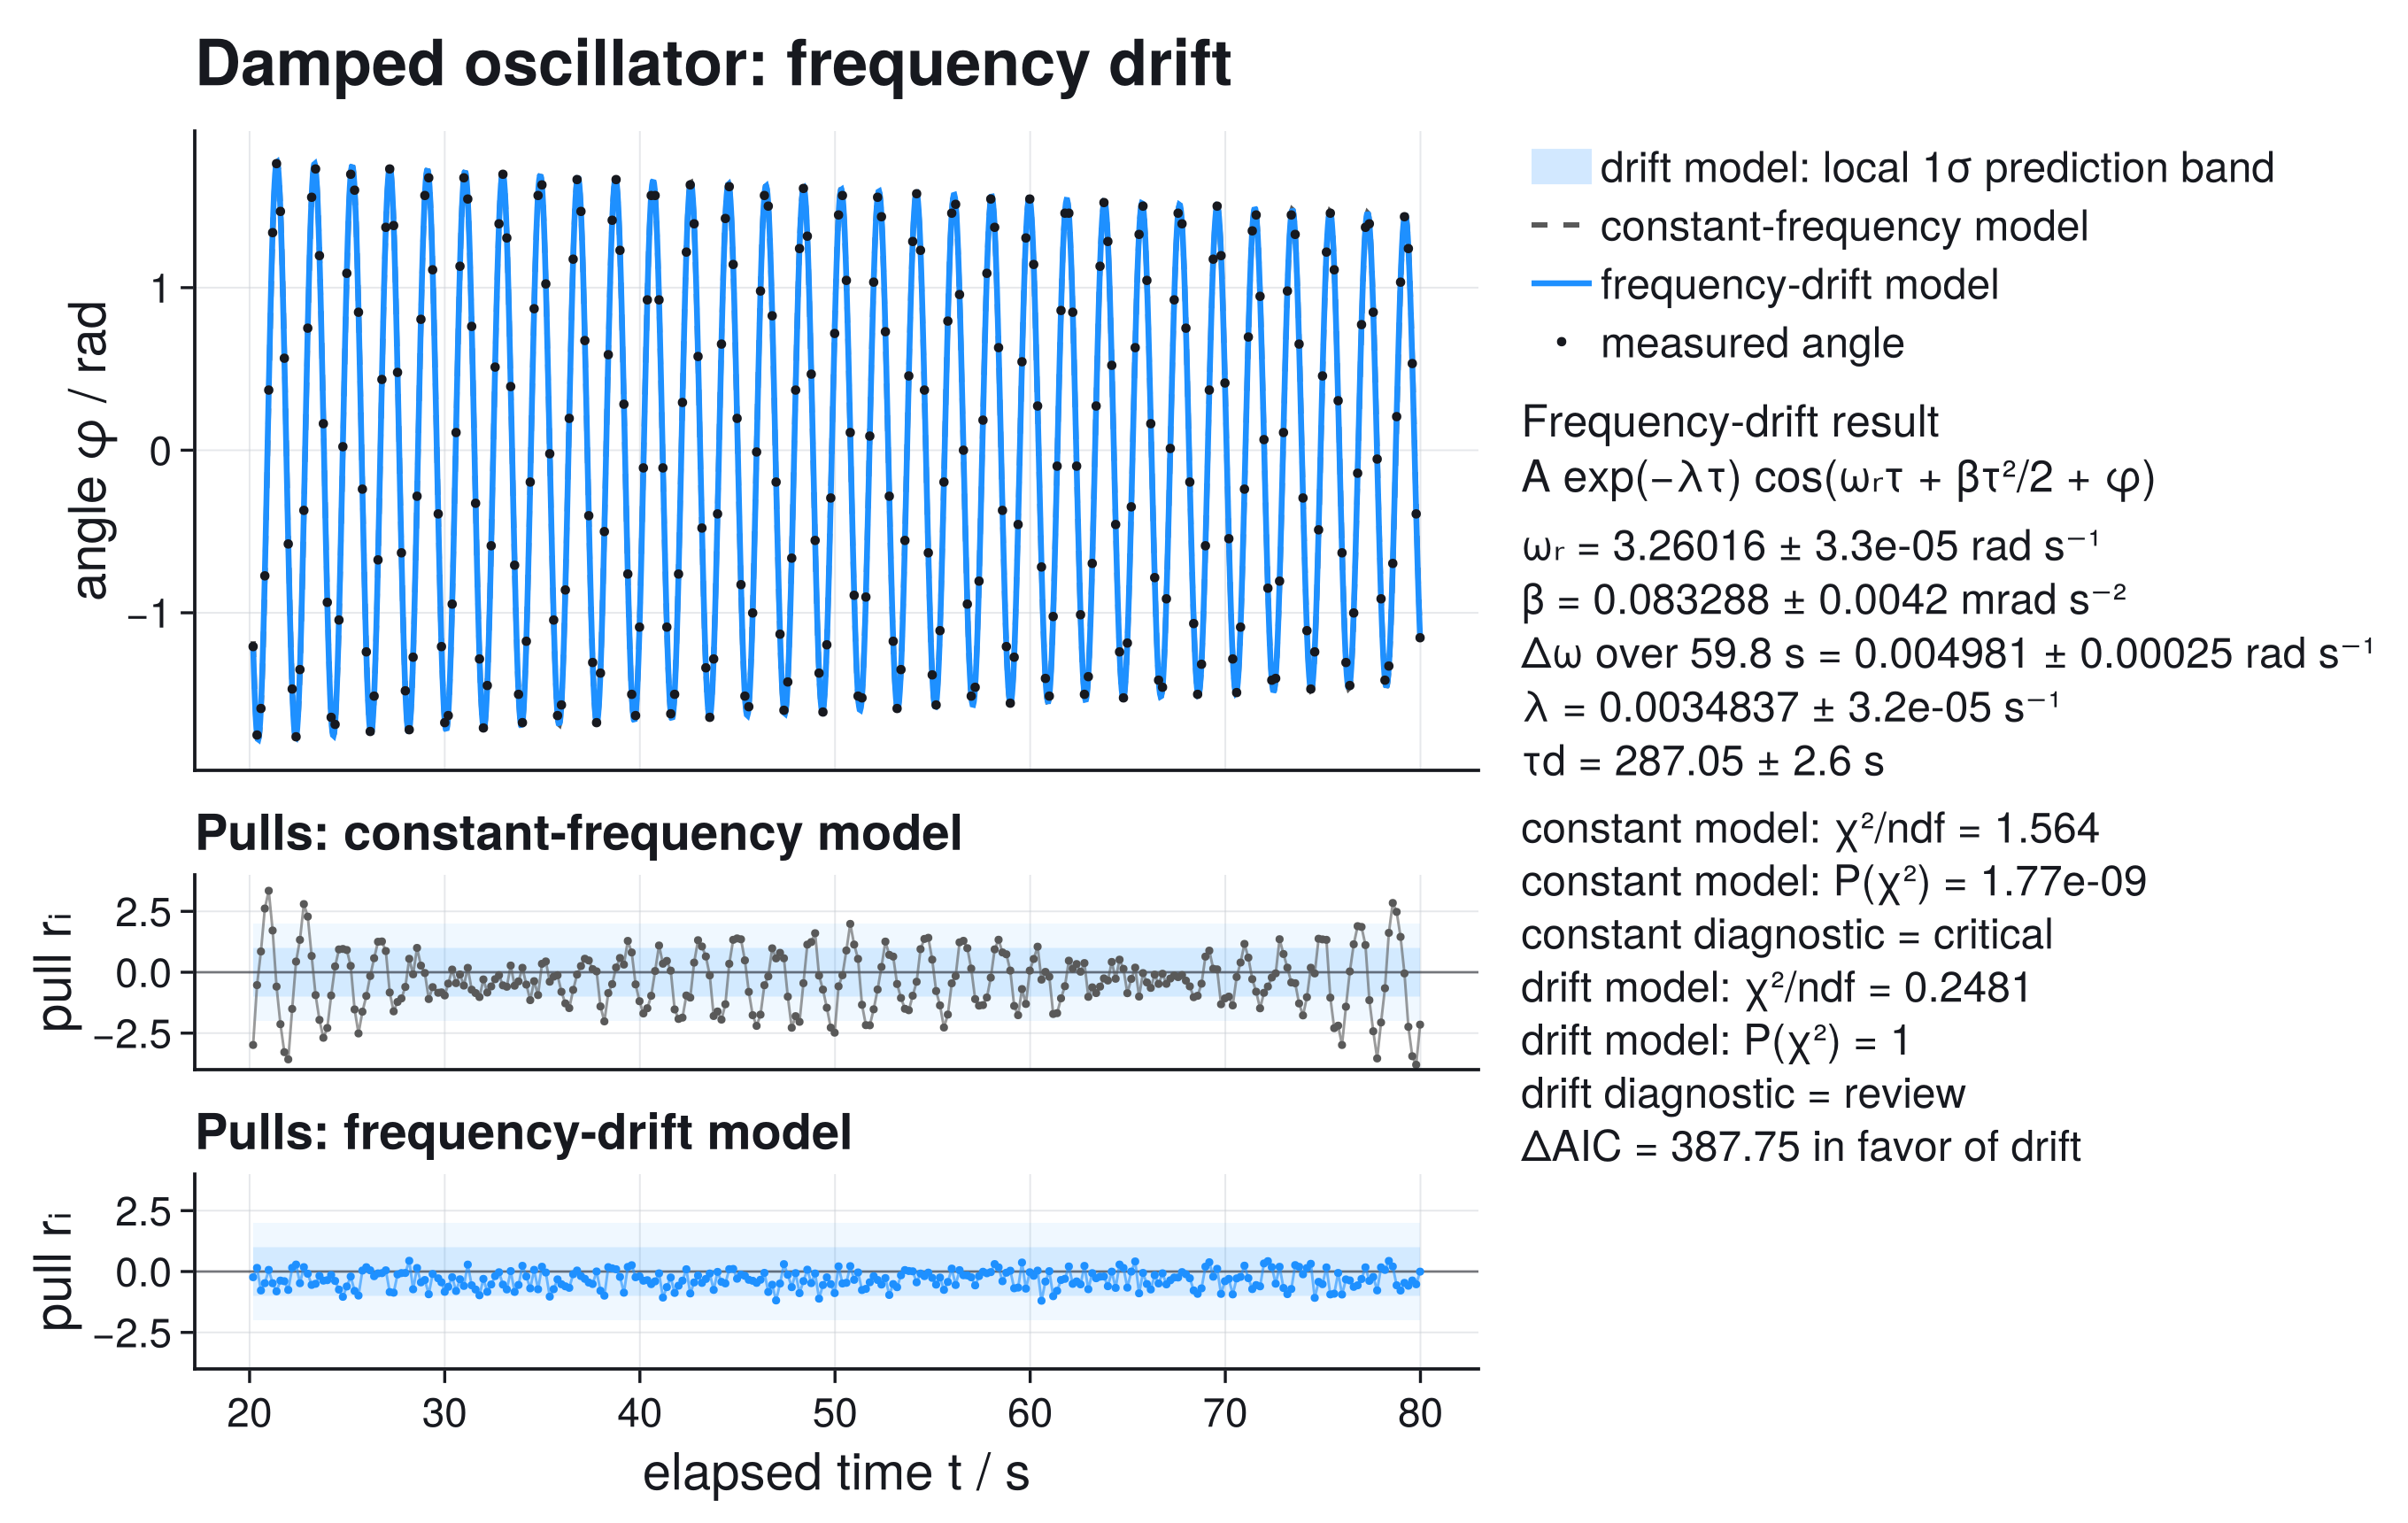
Damped oscillator
Discover why a visually convincing constant-frequency fit is statistically rejected, test a frequency-drift extension, and use pull structure to decide what must be investigated next.
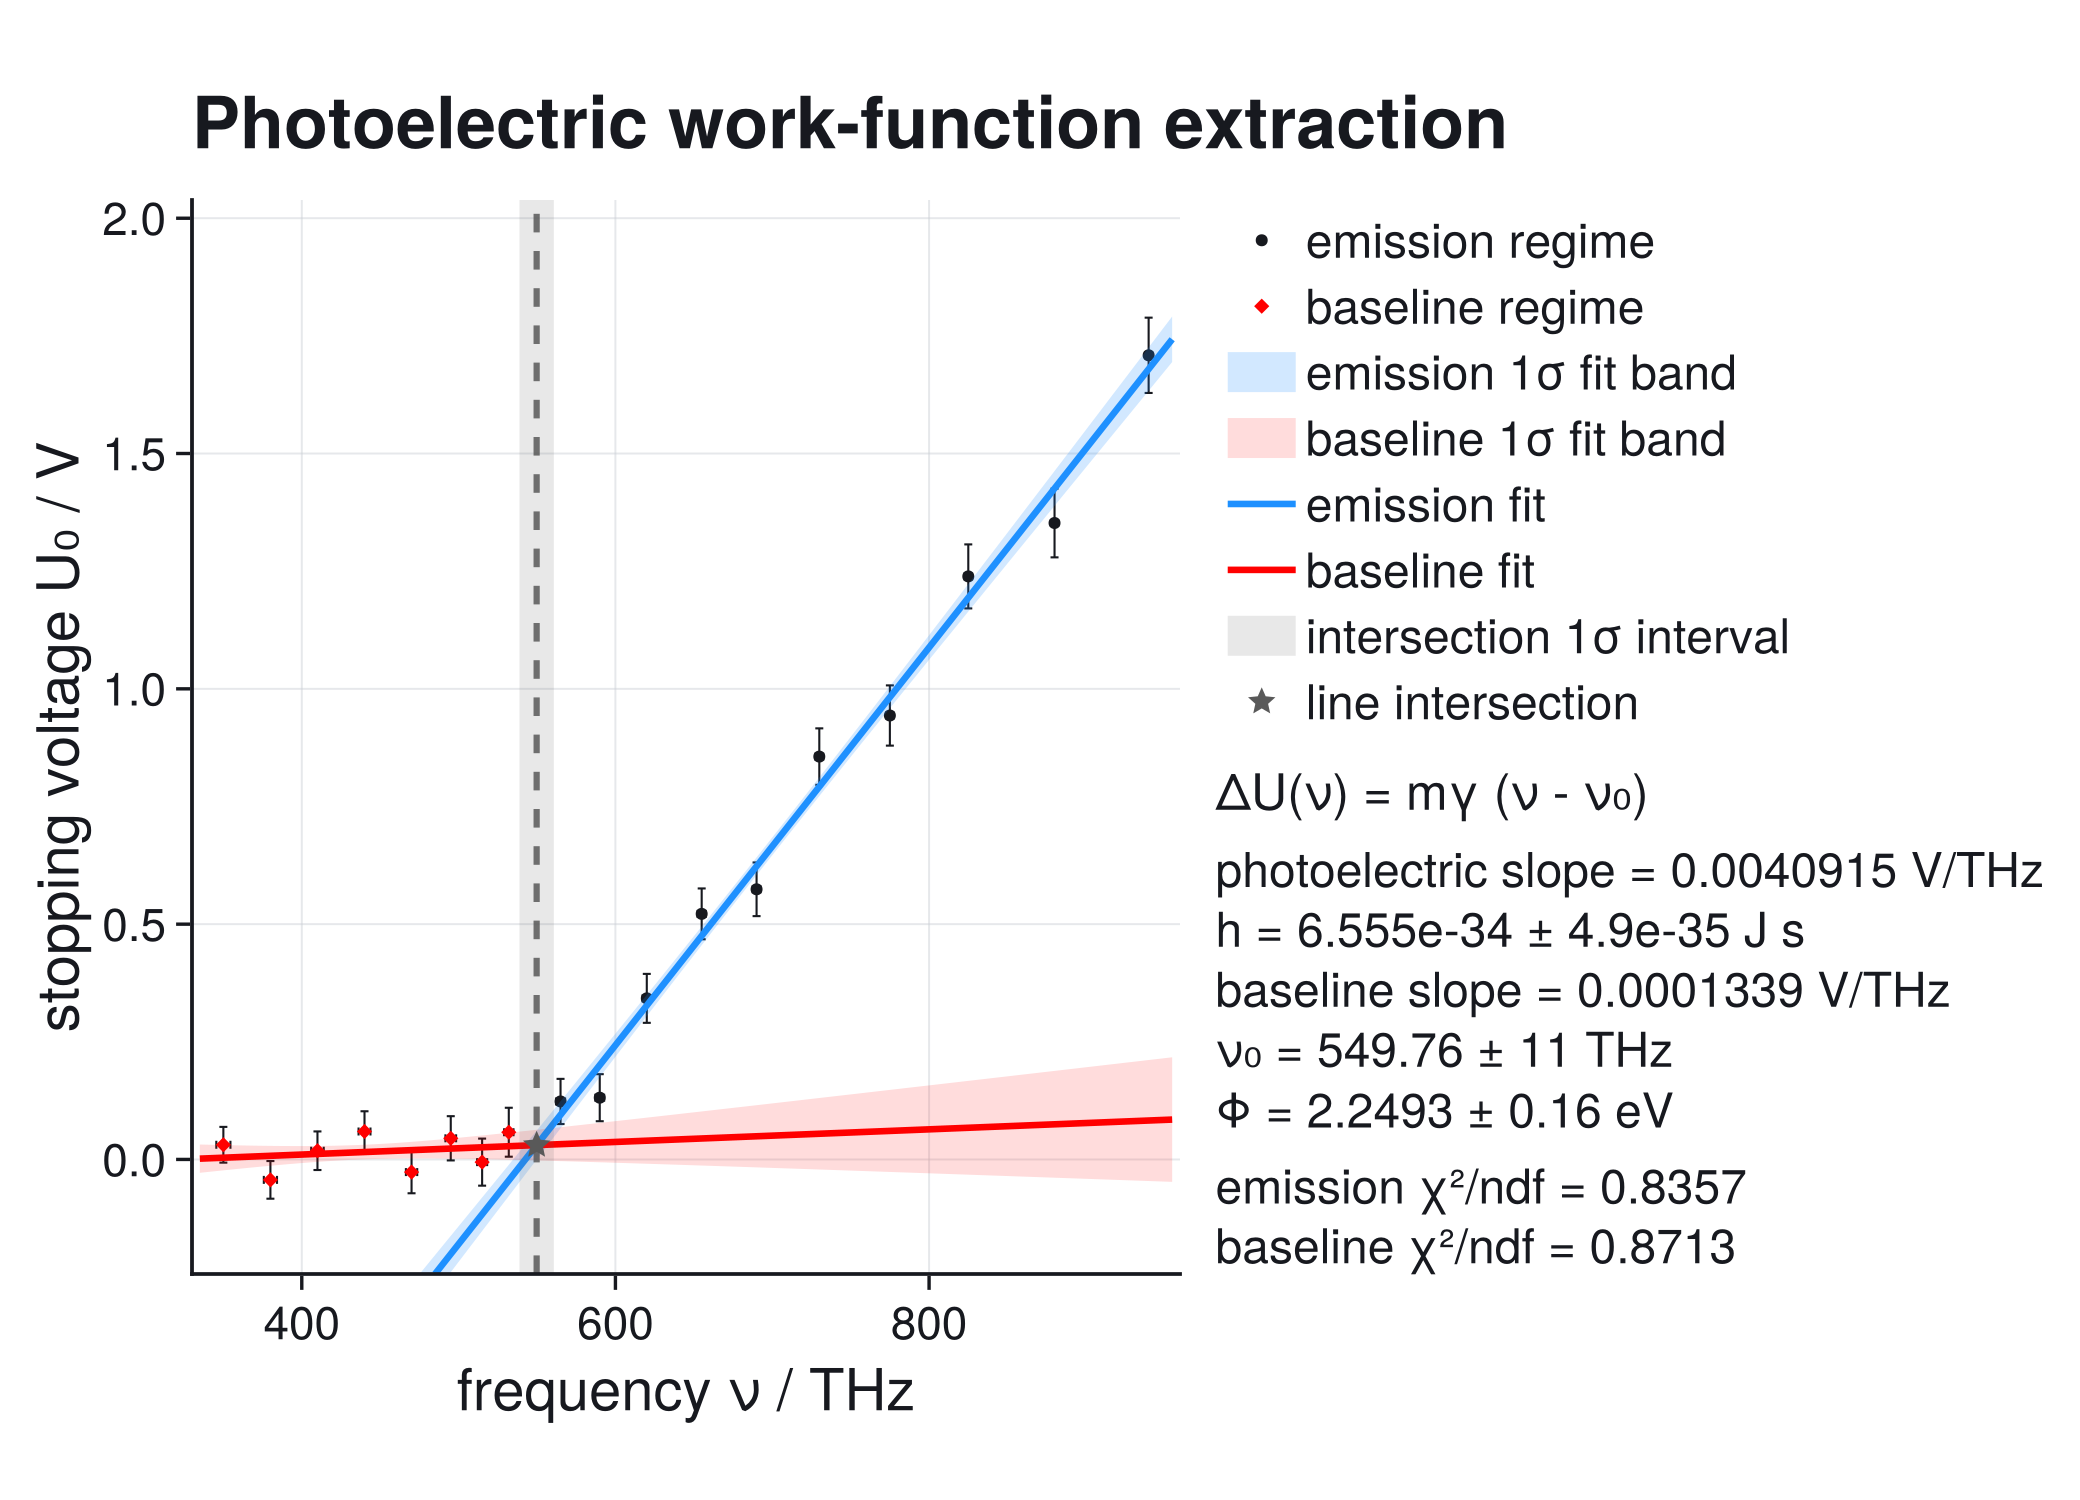
Photoelectric work function
Fit baseline and emission regimes separately, then propagate both covariance matrices into the threshold intersection and work function.
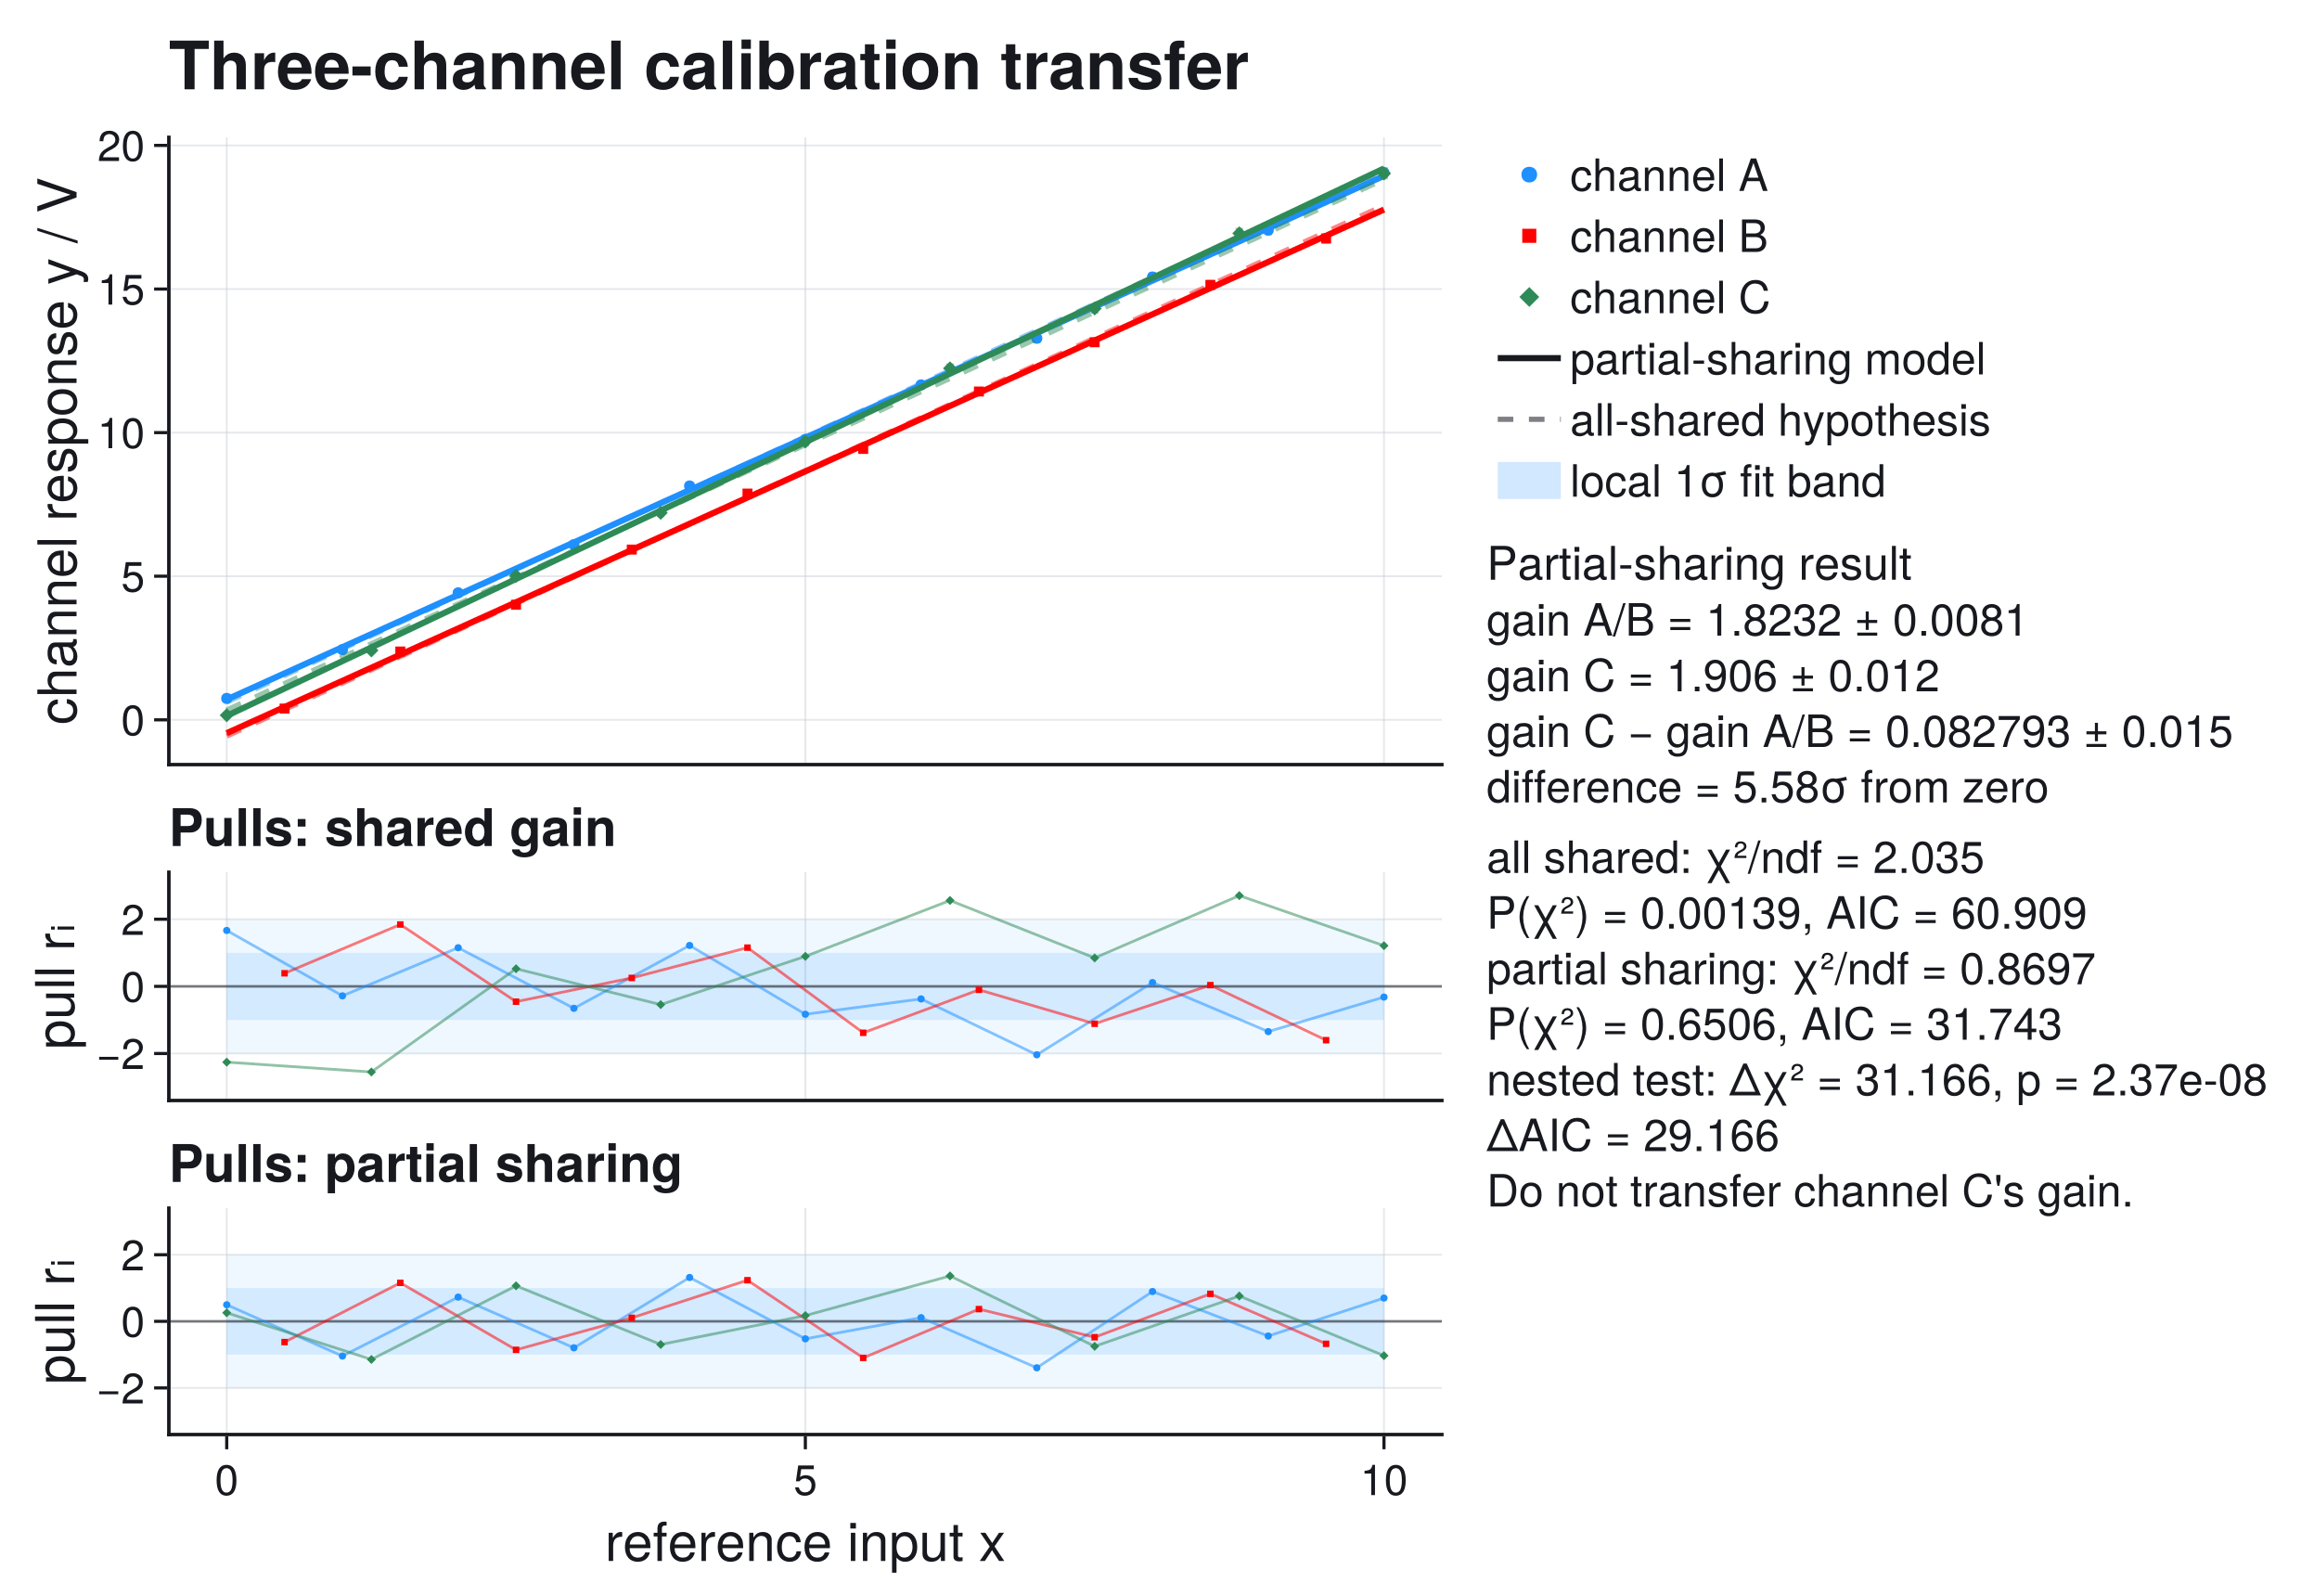
Multi-dataset fit
Test whether three calibration channels may share one gain, identify the incompatible channel from its pulls, and propagate the gain difference from the joint covariance.
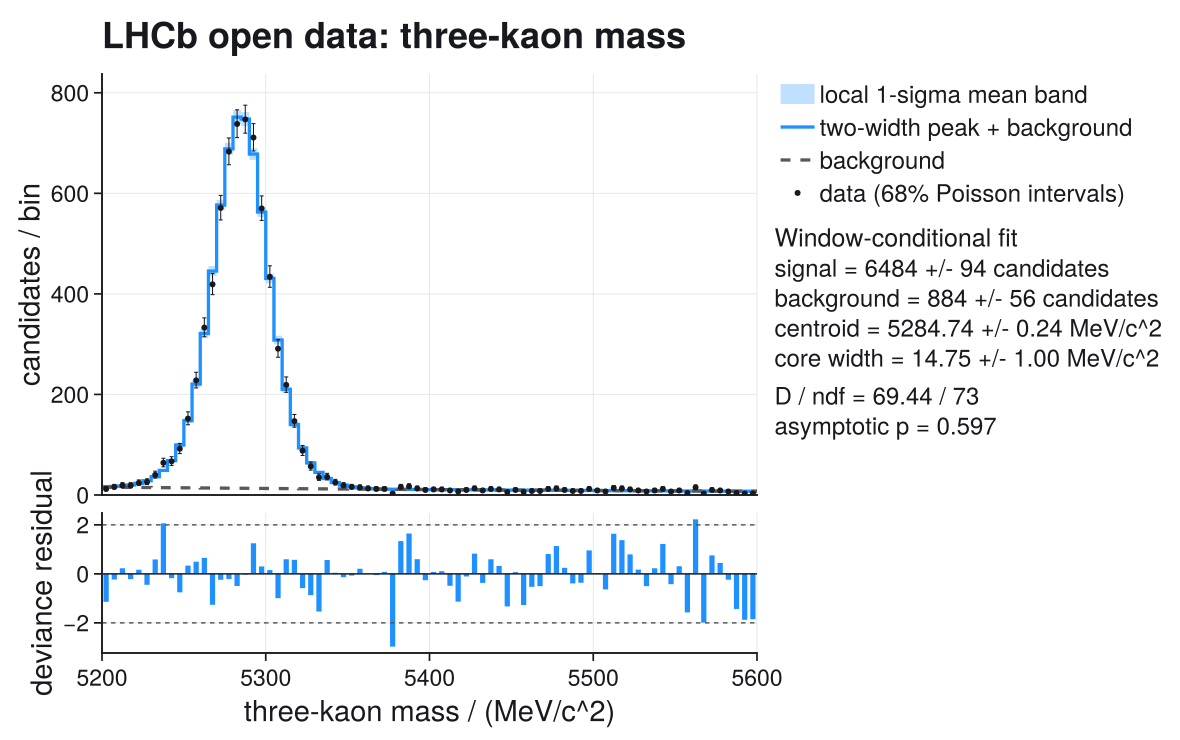
LHCb mass spectrum
Compose a named signal/background model, fit with NativeMinuit, and check yield sensitivity to the peak shape. Includes source DOI and reproducible ROOT selection.
Need help judging a result? Continue with Fitting for Practitioners. For derivations, use the Statistics Reference; for exact signatures and defaults, use the API Reference.
Settings
This document was generated with Documenter.jl version 1.19.0 on Tuesday 29 September 2026. Using Julia version 1.12.7.